Invoice Discounting in India: Returns, Risks & How HNIs Invest (2026)
27 May 2026 · Sachin Gadekar
A complete investor guide to invoice discounting in India - how HNIs evaluate deals, what returns are realistic, how risk is structured, the difference between buyer types, and how to build a diversified invoice discounting portfolio generating 10–15% annually.

India's HNI investors have a fixed income problem. Bank FDs pay 7% gross 4.9% after 30% tax. That barely beats inflation. Corporate bonds require long lock-ins. Debt mutual funds lost their indexation advantage after April 2023. And equity is too volatile for the portion of the portfolio that needs predictable income.
Invoice discounting has emerged as the most compelling answer to this problem not because it is risk-free, but because it is the rare instrument that delivers 10–15% annualised returns on short tenures with credit risk anchored to large corporate and PSU buyers rather than to market sentiment or interest rate cycles.
This guide is not a beginner's explainer of what invoice discounting is. It is an investor's guide to how to evaluate deals, what returns are realistic after tax and defaults, how to build a properly diversified invoice discounting portfolio, and what the critical differences are between a well-structured deal and a poorly structured one.
How Invoice Discounting Actually Works for the Investor
The mechanics are simple. An MSME supplies goods or services to a large corporate. The corporate owes payment in 60 days standard B2B trade credit. The MSME needs cash now. An investor advances 80–90% of the invoice value upfront. When the corporate pays on day 60, the investor receives principal plus the discount the difference between what they advanced and the full invoice value.
The investor's return comes from one thing: the time value of money between the advance date and the payment date. A ₹50 lakh invoice, 85% advance rate, 60-day tenure, 12% annualised:
Amount advanced: ₹42.5 lakhs
Return for 60 days at 12% annualised: ₹42.5L × 12% × (60/365) = ₹84,000
At maturity: investor receives ₹42.5L + ₹84,000 = ₹43,34,000
Annualised, that is 12% on deployed capital. In absolute terms, ₹84,000 earned in 60 days on ₹42.5 lakhs.
The critical investor insight: The credit exposure is on the corporate buyer FMCG company, PSU, listed manufacturer not on the MSME seller. The MSME's financial weakness is structurally irrelevant once the invoice is verified and the buyer is creditworthy. This is not MSME lending. It is corporate payment financing with the MSME as the pipeline, not the credit risk.
For the foundational explainer of invoice discounting mechanics, read: What Is Invoice Discounting?
What Returns Can HNIs Realistically Expect?
The honest answer requires separating three distinct yield numbers that are frequently conflated:
Deal yield: The annualised return on a specific invoice discounting deal as listed on a platform. Ranges from 9% (PSU buyers on TReDS) to 15%+ (smaller private corporate buyers). This is the gross, pre-tax yield on that one deal.
Portfolio yield: The blended annualised return across your full invoice discounting portfolio all active and matured deals combined. This is lower than the best deal yield because of reinvestment gaps (days when maturing capital is not yet deployed in a new deal) and the mix of higher and lower yield deals.
XIRR (portfolio-level true return): The most accurate measure accounts for the timing of every cash flow in and out of your invoice discounting portfolio. On a well-managed portfolio with minimal idle periods, XIRR typically tracks 0.5–1% below the blended deal yield.
| Buyer Type | Gross Deal Yield | Expected Portfolio XIRR (after reinvestment gaps) | Post-Tax XIRR (30% bracket) | Post-Tax XIRR (39% bracket) | Risk Level |
|---|---|---|---|---|---|
| Central PSU / CPSE (TReDS-backed) | 9%–12% | 8.5%–11.5% | 5.95%–8.05% | 5.19%–7.02% | Very Low — near sovereign |
| Large listed corporate (Nifty 500) | 11%–13% | 10.5%–12.5% | 7.35%–8.75% | 6.41%–7.63% | Low |
| Mid-market listed corporate (credit rated) | 13%–15% | 12.5%–14.5% | 8.75%–10.15% | 7.63%–8.85% | Low–Moderate |
| Unlisted private corporate (strong track record) | 14%–17% | 13%–16% | 9.1%–11.2% | 7.93%–9.76% | Moderate — higher careful due diligence required |
The realistic HNI expectation: A well-constructed invoice discounting portfolio across primarily large listed corporate and PSU buyers, with active reinvestment, generates portfolio XIRR of 10.5–12.5% gross translating to 7.35–8.75% post-tax at 30% slab. That is 2.45–3.85 percentage points more than AA corporate bonds post-tax, for equivalent or lower effective credit risk on strong buyer profiles.
For a detailed explanation of how XIRR differs from deal-level yield, read: XIRR vs IRR: Which Return Metric Should Investors Use and Why?
How to Evaluate an Invoice Discounting Deal: The HNI Framework
Every invoice discounting deal on a platform should be evaluated on six specific dimensions before deploying capital. Most investors check yield and tenure, the two least important variables. Here is the right framework:
1. Buyer identity and credit profile (most important)
Who owes the money? Is it a listed company? What is its credit rating? What is its payment track record on this platform? A deal backed by ONGC or Hindustan Unilever does not need the same scrutiny as a deal backed by an unlisted mid-market private company. Start here always.
2. Invoice authenticity verification
Is the invoice GST-verified? Is it cross-checked against the buyer's GSTN filings? An invoice that cannot be verified against the GST network is a meaningful fraud risk. On regulated platforms, GST verification is standard. On others, it may not be.
3. Recourse structure
Is this a with-recourse or non-recourse deal? In with-recourse: if the buyer defaults, the MSME seller is obligated to repay. If the MSME also cannot pay, the investor bears the loss. In non-recourse (standard on TReDS): the investor's claim is directly against the buyer. Non-recourse on strong buyers is structurally cleaner.
4. Tenure and advance rate
A 90-day deal at 85% advance rate has more duration risk than a 30-day deal at the same advance rate more time for the buyer's situation to change. Shorter tenures reduce duration risk. The advance rate (what percentage of invoice value is advanced) affects your effective yield calculation.
5. Concentration
Is this deal in the same sector as three other deals in your portfolio? If your invoice discounting portfolio has 40% in FMCG sector buyers, an FMCG sector shock hits 40% of your income simultaneously. Sector diversification within invoice discounting matters as much as buyer diversification.
6. Platform's historical performance on similar deals
What is the platform's default and delay rate on deals with comparable buyer profiles? ultra's credit loss rate on listed and PSU buyer deals has remained below 1%. That data point is more informative than the deal yield.
Buyer Quality: The Single Most Important Variable
This deserves its own section because it is the variable most retail investors underweight and the one most professional investors anchor on.
| Buyer Tier | Examples | Typical Payment Default Rate | Typical Payment Delay Rate | Appropriate Yield Demand | Investor Action |
|---|---|---|---|---|---|
| Tier 1 — Sovereign/PSU | ONGC, NTPC, BHEL, NHAI, state government entities | <0.1% | 3%–5% | 9%–12% | Invest without hesitation — sovereign credit quality |
| Tier 2 — Large Listed Corporate (Nifty 500) | HUL, Tata Motors, Mahindra, Reliance Retail, Asian Paints | <0.5% | 5%–8% | 11%–13% | Invest — strong credit; verify payment track record on platform |
| Tier 3 — Mid-Cap Listed Corporate (credit rated) | Rated NBFCs, mid-cap manufacturers, listed logistics companies | 0.5%–2% | 8%–12% | 13%–15% | Invest selectively — check rating, recent financials, sector health |
| Tier 4 — Unlisted Private Corporate | Private manufacturers, private retailers, unlisted distributors | 2%–8% | 10%–20% | 15%–18% | Invest cautiously — require strong track record on platform; limit to 15% of portfolio |
| Tier 5 — Unverified / No Disclosure | Platforms that do not disclose buyer identity | Unknown — avoid | Unknown — avoid | Any yield — avoid | Do not invest — lack of buyer disclosure is a disqualifying red flag |
The HNI rule on buyer quality: Build your core portfolio (70–80%) on Tier 1 and Tier 2 buyers. Add Tier 3 selectively for yield enhancement (15–20% of portfolio). Avoid Tier 5 entirely regardless of yield. Tier 4 only for experienced investors with specific platform track record data.
Understanding Deal Structures: What You Are Actually Buying
Not all invoice discounting deals are structured the same way. The structural differences meaningfully affect your risk-return profile.
Standard invoice discounting (most common on platforms):
Single invoice, single buyer, single MSME seller. You advance against one verified invoice and receive repayment when that specific buyer pays. Transparent, auditable, straightforward.
Pool/portfolio discounting:
Multiple invoices from one seller pooled together you fund a basket rather than a single invoice. Provides implicit diversification across multiple receivables from the same seller but potentially different buyers. Read the pool composition carefully.
Reverse factoring / buyer-led programmes:
The buyer initiates the transaction formally approving invoices on the platform before discounting. The buyer's approval is documented prior to funding. This significantly reduces fraud risk and gives the investor stronger legal standing on the payment obligation. Preferred structure when available.
Digital invoice discounting (GSTN-linked):
Invoices verified directly against the GST network before being offered to investors. The GSTN match confirms the invoice is real, filed, and acknowledged by the buyer in their own GST records. The gold standard for invoice authenticity.
TReDS-backed discounting:
Discounting on RXIL, M1xchange, or Invoicemart RBI-licensed Market Infrastructure Institutions. Non-recourse structure, mandatory buyer acknowledgment, RBI regulatory oversight. The most protected structure available. Yields are lower (9–12%) but the risk profile is near-sovereign on CPSE buyers.
Risks Ranked Honestly
Risk 1 - Buyer payment delay (most common adverse event)
The buyer pays late 15–30 days beyond the invoice due date but pays in full. The investor receives principal plus interest for the extended period. Impact: nuisance, not loss. Frequency: 3–8% of transactions depending on buyer tier.
Risk 2 - Buyer genuine default (rare on Tier 1/2 buyers)
The buyer refuses or is unable to pay. On Tier 1/2 buyers, this is extremely rare these companies have audited payables obligations, regulatory scrutiny, and reputational consequences for supplier payment defaults. The risk is real but the probability is very low on strong buyers.
Risk 3 - Invoice fraud (mitigated by GST verification)
MSME fabricates an invoice, or pledges the same invoice to multiple platforms. Eliminated on platforms with GSTN-linked verification and buyer acknowledgment. A genuine risk on platforms that do not verify invoices against the tax network.
Risk 4 - Platform risk (mitigated by escrow)
The platform faces financial difficulty and misappropriates investor funds. Mitigated by escrow-based fund flows investor capital held in a regulated third-party escrow account separate from the platform's operating funds.
Risk 5 - Reinvestment risk (structural)
Capital returns every 30–90 days and must be actively redeployed. In a falling yield environment, new deals may yield less than matured ones. Not a credit risk but a portfolio management discipline requirement.
| Risk | Probability (Tier 1-2 buyers) | Probability (Tier 3-4 buyers) | Impact if Occurs | Mitigation |
|---|---|---|---|---|
| Payment delay (15–30 days) | 3%–8% | 10%–20% | Low — interest accrues for delay period | Platform follow-up; additional interest for delayed period |
| Buyer genuine default | <0.5% | 2%–8% | High — partial or full capital loss | Buyer quality screening; portfolio diversification across 15+ buyers |
| Invoice fraud | Very Low (<0.1%) with GSTN verification | Low–Moderate without verification | High — full capital loss on fraudulent invoice | GSTN-linked invoice verification; buyer acknowledgment; use regulated platforms only |
| Platform failure / fund misappropriation | Very Low on regulated platforms | Very Low on regulated platforms | Very High — potential loss of all invested capital | Escrow-based fund flows; use only platforms with transparent fund flow disclosure |
| Reinvestment risk | Moderate — structural to the instrument | Moderate | Low — lower yield on reinvested capital | Active portfolio management; auto-reinvest features on platforms |
For a complete deep-dive into credit risk and default rates in invoice discounting, read: Is Invoice Discounting Safe? Understanding Credit Risk and Default Rates
Post-Tax Returns at HNI Income Levels
Invoice discounting returns are classified as interest income under "Income from Other Sources", taxed at slab rate. No special tax treatment, no capital gains benefit. This makes tax bracket the single biggest variable in the post-tax return calculation.
| Annual Income | Effective Tax Rate | Gross ID Return | Post-Tax Return | Equivalent FD Return Needed to Match | Advantage over FD Post-Tax |
|---|---|---|---|---|---|
| ₹25–50 Lakhs | 31.2% | 12% | 8.26% | 12% (FDs also taxed at 31.2%) | +3.34% over 7% FD (post-tax: 4.92%) |
| ₹50L–₹1 Crore | 34.32% | 12% | 7.88% | Same — both at slab rate | +3.28% over 7% FD (post-tax: 4.60%) |
| ₹1–2 Crore | 35.88% | 12% | 7.69% | Same — both at slab rate | +3.22% over 7% FD (post-tax: 4.49%) |
| ₹2–5 Crore | 39% | 12% | 7.32% | Same — both at slab rate | +3.05% over 7% FD (post-tax: 4.27%) |
| ₹5 Crore+ (old regime) | 42.74% | 12% | 6.87% | Same — both at slab rate | +2.86% over 7% FD (post-tax: 4.01%) |
Annual income advantage at scale: On ₹1 crore deployed in invoice discounting at 12% gross versus 7% FD at the 35.88% bracket the post-tax income difference is ₹3.22 lakhs annually. Over 10 years, compounded at the same rate, that gap compounds to approximately ₹38 lakhs in additional wealth purely from instrument selection.
For the full HNI tax treatment guide including invoice discounting taxation, read: Invoice Discounting Taxation
Building a Diversified Invoice Discounting Portfolio
The three rules of invoice discounting portfolio construction:
Rule 1: Diversify across buyers, not just deals
Having 20 deals is not the same as having 20 different buyers. If 20 deals are all backed by one corporate buyer, that is a concentrated single-counterparty exposure. True diversification requires a minimum of 10–15 distinct buyers across different sectors. If any single buyer represents more than 10% of your total deployed capital, you have concentration risk.
Rule 2: Ladder maturities to create continuous cash flow
Rather than deploying ₹1 crore in one tranche, stagger deployments across deals with 30-day, 60-day, and 90-day tenures. This creates a portfolio that is constantly maturing and recycling — generating near-monthly cash flows rather than a single lump sum return. Laddering also reduces reinvestment risk by spreading the redeployment timing.
Rule 3: Maintain a 10–15% uninvested buffer
Always keep 10–15% of your invoice discounting allocation in a liquid instrument (liquid fund, short-term FD). This buffer provides: (a) capital for immediate deployment when a strong deal appears, (b) protection if multiple deals delay simultaneously, and (c) comfort — you are not fully locked up.
Sample portfolio structure for ₹50 lakh deployment
| Tranche | Amount | Buyer Tier | Tenure | Yield | Purpose |
|---|---|---|---|---|---|
| Core Tier 1/2 — PSU + Large Listed (5 deals) | ₹20 Lakhs (40%) | Tier 1–2 | 60–90 days | 10%–12% | Capital preservation with above-FD yield; portfolio anchor |
| Mid-market Listed (5 deals) | ₹15 Lakhs (30%) | Tier 3 | 45–60 days | 12%–14% | Yield enhancement; selective based on rating and track record |
| Short-tenure high-churn (5 deals) | ₹10 Lakhs (20%) | Tier 2–3 | 30 days | 11%–13% | Rapid recycling; keeps XIRR high through continuous reinvestment |
| Liquid buffer | ₹5 Lakhs (10%) | N/A — liquid fund | Instant | 6.5%–7% | Deployment reserve; emergency liquidity; reinvestment readiness |
Blended portfolio yield on this structure: approximately 11.5–12% gross, 8–8.4% post-tax at 30% bracket, with continuous monthly recycling from the short-tenure tranche.
Invoice Discounting vs Other Fixed Income Instruments
| Instrument | Gross Yield | Post-Tax (30%) | Tenure | Credit Risk | Liquidity | Compounding Frequency | HNI Verdict |
|---|---|---|---|---|---|---|---|
| Invoice Discounting (Tier 1–2 buyers) | 11%–13% | 7.7%–9.1% | 30–90 days | Low (large corporate/PSU) | Low — locked for tenure | 6x per year (60-day average) | Best risk-adjusted short-tenure yield available |
| AA Corporate NCD | 10%–10.5% | 7%–7.35% | 2–5 years | Low (AA issuer) | Moderate (listed) | 12x per year (monthly coupon) | Better for multi-year income lock-in; lower yield than ID |
| Bank FD | 7% | 4.9% | Flexible | Very Low (DICGC ₹5L) | Moderate (penalty on break) | 1–4x per year | Baseline — use only as liquidity buffer above ₹5L per bank |
| Tax-Free PSU Bond | 5.5% YTM (tax-free) | 5.5% (no tax) | 5–10 years remaining | Very Low (AAA PSU) | Moderate (secondary market) | 1–2x per year | Worth it above ₹1Cr income; not for core yield generation |
| Private Credit AIF (Cat II) | 14%–18% gross | 9.8%–11.2% (net of fees) | 3–5 years | Moderate (mid-market borrowers) | Very Low (locked) | Quarterly distributions | Best absolute yield; illiquid; ₹1Cr minimum |
The portfolio logic: Invoice discounting and private credit AIF are complementary instruments for HNIs who want maximum fixed income yield. Invoice discounting provides the liquid, continuously recycling short-tenure layer (30–90 days) at 11–13%. Private credit AIF provides the illiquid, high-yield core (3–5 years) at 12–18%. Together, they form a fixed income portfolio that outperforms vanilla corporate bonds and FDs by 3–5 percentage points post-tax.
For a comprehensive guide to how these instruments work together in a portfolio, read: High Yield Investments for HNIs in India Generating 10–18% Annually
How HNIs Are Using Invoice Discounting in 2026
Three specific deployment patterns have emerged among HNI investors in 2026:
Pattern 1: The FD replacement (most common): HNIs with ₹25–100 lakhs previously sitting in FDs at 7% are shifting 30–40% of that allocation to invoice discounting on Tier 1–2 buyers. The rationale: they are already taking bank credit risk above ₹5 lakhs per bank (beyond DICGC coverage). Shifting to buyer credit risk on ONGC or HUL is not necessarily higher risk but the yield is 4–5% higher.
Pattern 2: The income engine: HNIs building passive income portfolios are using invoice discounting as the "high-yield, short-tenure" layer typically 20–30% of total fixed income. The 30–90 day recycling creates near-monthly income that bonds cannot replicate at the same yield.
Pattern 3: The portfolio complement: Sophisticated HNIs running corporate bond ladders are adding invoice discounting as the floating-rate complement. Corporate bonds lock in fixed rates for 2–5 years. Invoice discounting resets every 30–90 days if market yields rise, new invoice discounting deals automatically reflect the higher rate environment. The combination creates a portfolio that is neither fully fixed-rate nor fully floating.
Budget 2026 tailwind: The CPSE TReDS mandate requiring all Central Public Sector Enterprises to use TReDS for MSME payments has substantially increased the supply of PSU-backed, near-sovereign invoice discounting inventory. HNIs now have access to invoices backed by ONGC, BHEL, NTPC, HAL, and hundreds of CPSEs at 10–13% yields through regulated platforms. This is genuinely new inventory that did not exist at this scale two years ago.
FAQs
Q1. What returns can investors earn from invoice discounting in India in 2026?
Gross returns of 9–15% annualised depending on buyer quality. PSU and CPSE buyers: 9–12%. Large listed corporates: 11–13%. Mid-market listed buyers: 13–15%. Post-tax at 30% slab: 6.3–10.5%. Portfolio XIRR (accounting for reinvestment gaps) typically tracks 0.5–1% below peak deal yields. On a well-managed portfolio of primarily Tier 1–2 buyers, realistic post-tax portfolio XIRR is 7–9%.
Q2. Is invoice discounting safe for HNI investors in India?
On Tier 1–2 buyers (PSUs, large listed corporates) with GSTN-verified invoices and escrow fund flows, invoice discounting carries low credit risk ultra's credit loss rate on listed/PSU buyer deals has remained below 1%. Payment delays of 15–30 days occur in 3–8% of transactions but typically resolve fully. It is not as safe as a bank FD but significantly safer than MSME lending or P2P, and the yield premium adequately compensates for the managed risk on strong buyers.
Q3. What is the minimum investment for invoice discounting in India?
On Ultra, the minimum investment per deal is ₹25,000. For a properly diversified portfolio (15–20 deals across different buyers), a realistic minimum corpus is ₹3–5 lakhs. Ultra recommends HNI investors deploy ₹10 lakhs or more to achieve meaningful diversification and the portfolio management benefits of continuous recycling.
Q4. How is invoice discounting taxed in India?
Returns are classified as interest income under "Income from Other Sources" and taxed at the investor's applicable slab rate up to 30% for most investors, up to 42.74% for ultra-HNIs under the old regime. TDS at 10% is deducted if annual interest from a single source exceeds ₹5,000 adjustable against final tax liability. The tax treatment is identical to FD interest. The post-tax advantage of invoice discounting over FDs comes from the higher gross yield, not a tax structure difference.
Q5. What is the difference between invoice discounting and MSME lending for investors?
In invoice discounting, the credit risk is on the corporate buyer who owes the invoice payment not on the MSME seller. A financially weak MSME can still generate a safe invoice discounting investment if the buyer is creditworthy. In MSME lending, the credit risk is directly on the MSME's ability to repay an entirely different (and typically higher) risk profile. Invoice discounting is corporate payment financing that happens to involve an MSME as the seller. This distinction is the core of why invoice discounting on strong buyers delivers better risk-adjusted returns than MSME lending.
Q6. How does the CPSE TReDS mandate affect invoice discounting returns in 2026?
Budget 2026–27 mandated all Central Public Sector Enterprises (CPSEs) to use TReDS for MSME payments. This has significantly expanded the supply of PSU-backed, near-sovereign invoice discounting inventory — ONGC, BHEL, NTPC, HAL, and hundreds of CPSEs now mandatorily route MSME payments through TReDS-linked platforms. For investors, this means more deals at the lowest-risk end of the spectrum (9–13% yields, near-sovereign buyer quality) improving the quality profile of the overall investable universe.
Q7. Can NRIs invest in invoice discounting in India?
Yes. NRIs can invest in invoice discounting through NRE account-linked demat accounts on regulated platforms. Returns are credited to the NRE account and are fully repatriable. TDS at 10% is deducted on interest income, adjustable under applicable DTAA provisions for NRIs in countries with tax treaties with India.
Disclaimer
This article is for informational and educational purposes only and does not constitute investment advice. Invoice discounting involves credit risk and is not insured. Returns are indicative based on current market conditions. Past performance is not a guarantee of future results. Please conduct your own due diligence before investing.
Recent articles
View all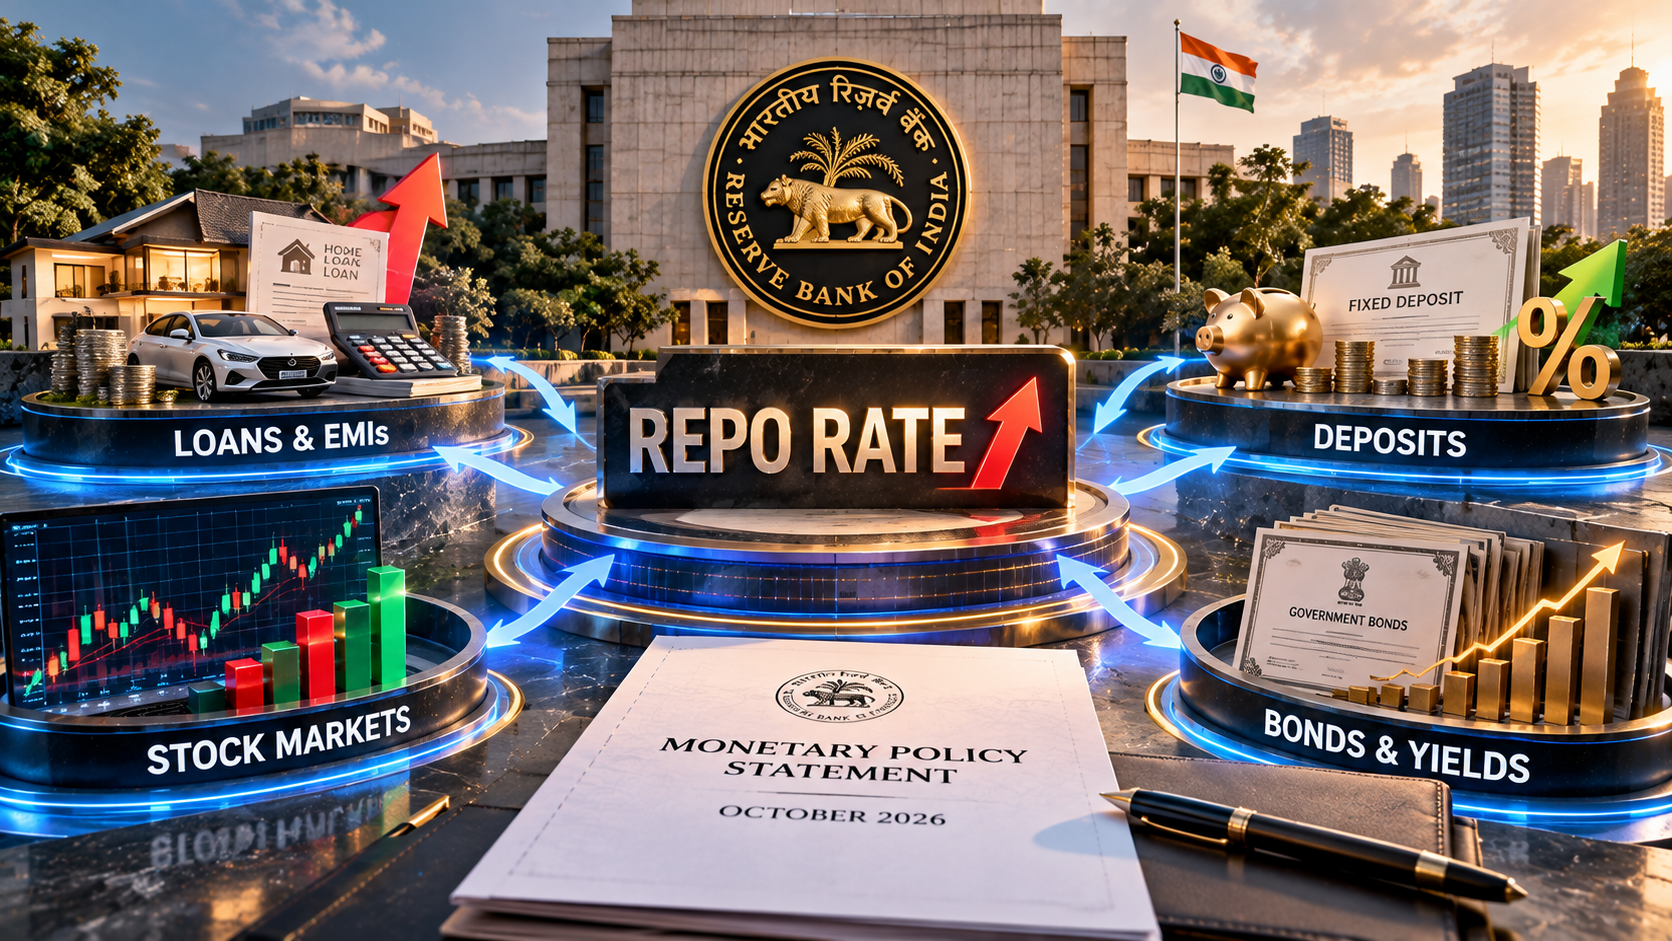
finance
RBI Repo Rate Hike: October 2026 Policy Update, Impact on Loans, EMIs, Deposits & Markets
A simple guide to the October 2026 RBI repo rate hike, what it means for borrowers, depositors, investors, banks and the broader economy.
Sachin Gadekar
·
08 Oct 2026

IPO
Reliance Jio IPO: Date, Price, GMP, Valuation, Review & Details
A complete guide to Reliance Jio IPO 2026, covering Jio Platforms IPO details, issue size, expected date, price band status, GMP context, shareholder quota, company profile, financials, valuation and risks.
Sachin Gadekar
·
07 Oct 2026

IPO
HD Fire Protect IPO Details: Date, Price, GMP, Review & How to Apply
A complete guide to HD Fire Protect IPO 2026, covering issue size, OFS structure, price band, lot size, GMP context, company profile, financials, risks, valuation and application process.
Sachin Gadekar
·
07 Oct 2026

IPO
Nityas Gems & Jewellery IPO Details: Date, Price, GMP, Review & How to Apply
A complete guide to Nityas Gems & Jewellery IPO 2026, covering issue size, GMP context, price band, lot size, company profile, financials, risks, valuation and application process.
Sachin Gadekar
·
05 Oct 2026