XIRR vs IRR: Which Return Metric Should Investors Use and Why?
20 May 2026 · Sachin Gadekar
A practical guide to understanding IRR, XIRR, and CAGR for modern investors evaluating SIPs, bonds, alternative investments, and cashflow-based portfolios
Every investment platform, fund manager, and wealth advisor quotes returns differently. One fund shows 18% IRR. Another shows 14% XIRR. Your invoice discounting portfolio shows 12% annualised. Your mutual fund statement shows CAGR. Your PE fund shows both IRR and MOIC.
These are not the same number measuring the same thing. Using the wrong metric to compare investments leads to systematically wrong decisions - and it happens constantly, even among experienced investors.
This guide gives you a clear, practical framework: what each metric actually measures, which one applies to each investment type, how to calculate XIRR yourself in Excel, and why - in the specific context of invoice discounting, bonds, SIPs, and AIFs - getting this right materially changes which investment wins the comparison.
Why Return Metrics Matter More Than Most Investors Think
Consider this scenario:
Investment A: 18% IRR, 2-year tenure, ₹10 lakh invested
Investment B: 14% XIRR, 3-year tenure, multiple cash flows, ₹10 lakh invested
Which performed better? You cannot tell from those numbers alone - because IRR and XIRR are not directly comparable without knowing the cash flow timing, the reinvestment assumptions embedded in each metric, and whether the quoted rates are truly annualised on the same basis.
This is not a hypothetical concern. When investors compare:
Invoice discounting returns (typically quoted as annualised yield on 30–90 day deals)
Mutual fund SIP returns (quoted as XIRR)
Corporate bond returns (quoted as YTM or coupon rate)
Private equity fund returns (quoted as IRR or MOIC)
...they are comparing fundamentally different calculations and mistaking them for the same kind of number.
Getting this right is not financial jargon for its own sake. It directly determines whether you make the right allocation decision between instruments.
The Four Return Metrics Explained
| Metric | Full Form | What It Measures | Cash Flow Assumption | Best Used For |
|---|---|---|---|---|
| IRR | Internal Rate of Return | The annualised rate of return at which the net present value of all cash flows equals zero | Assumes regular, periodic cash flows (annually, quarterly, monthly) | Capital budgeting, corporate project evaluation, fixed coupon bonds with regular payments |
| XIRR | Extended Internal Rate of Return | The annualised rate of return accounting for actual dates of each cash flow - regular or irregular | Uses actual dates - no assumption of periodicity | SIPs with irregular dates, invoice discounting portfolios, mixed investment/withdrawal portfolios, private equity with staged drawdowns |
| CAGR | Compound Annual Growth Rate | The smoothed annual growth rate from a single starting value to a single ending value | Single lump-sum investment, single terminal value - no interim cash flows | Lump sum equity/bond investments, benchmarking index performance, single-transaction return comparison |
| MOIC | Multiple on Invested Capital | Total cash returned divided by total cash invested - a simple absolute multiple, not annualised | No time value consideration - purely how many times did you get your money back | Private equity, venture capital - understanding absolute return magnitude separately from time efficiency |
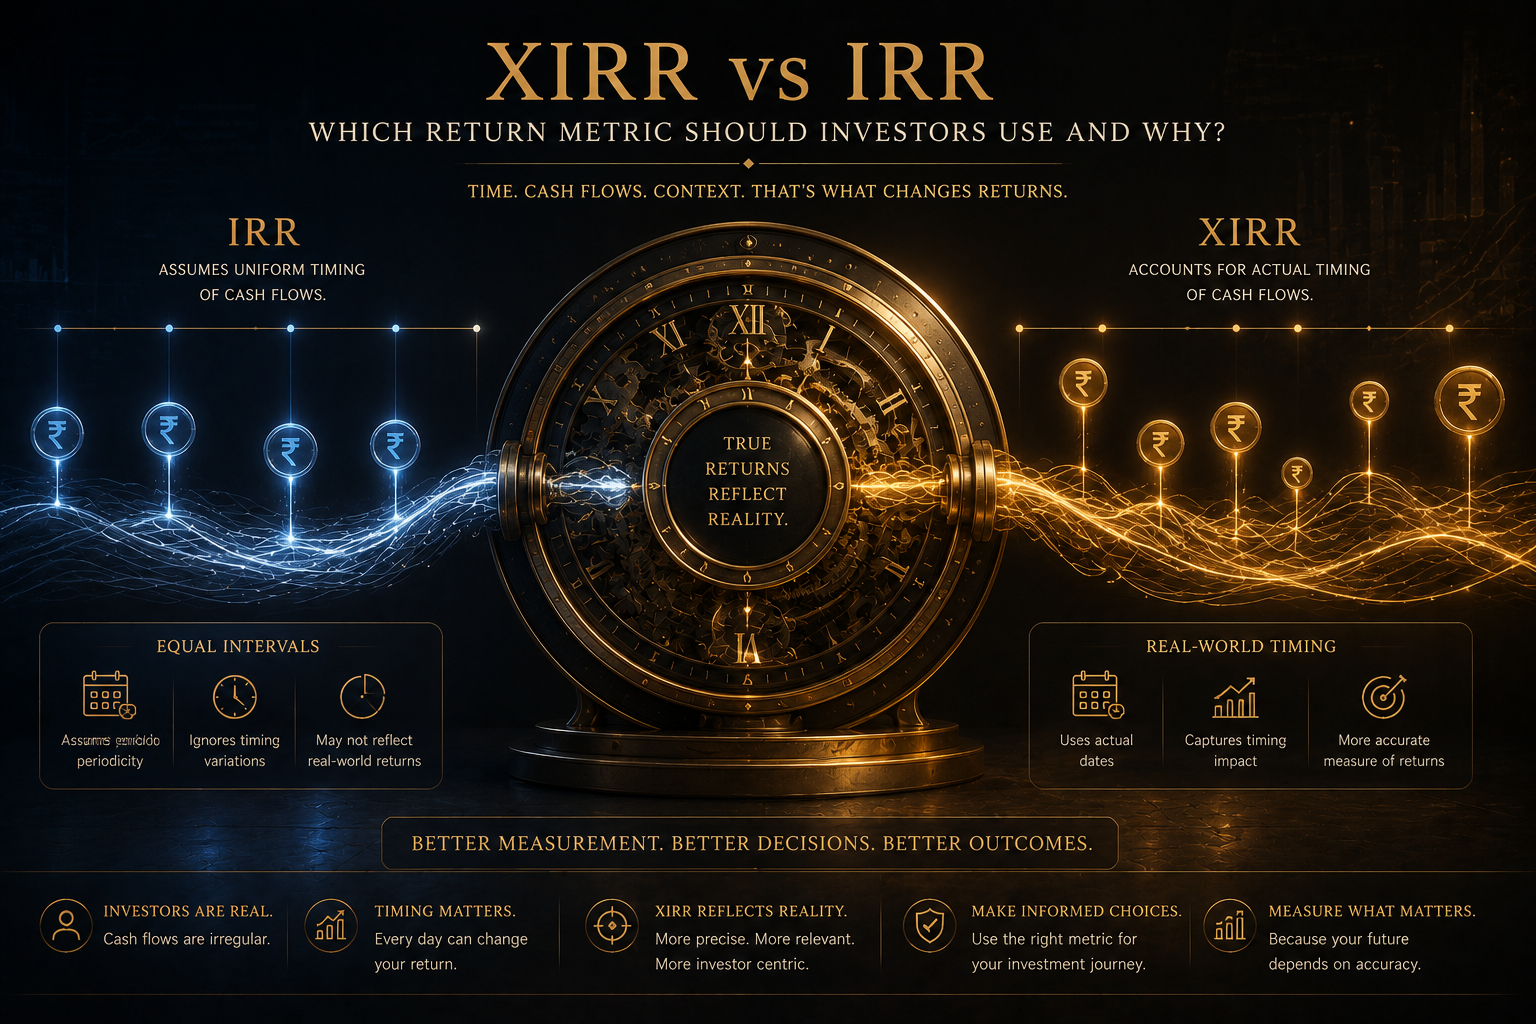
IRR: Internal Rate of Return
IRR is the discount rate that makes the Net Present Value (NPV) of all cash flows from an investment equal to zero. In simpler terms: it is the annualised rate of return that perfectly accounts for all cash in and cash out - assuming those cash flows happen at regular intervals.
The NPV framework behind IRR:
If you invest ₹10 lakhs today and receive ₹2 lakhs at the end of Year 1, ₹3 lakhs at Year 2, and ₹8 lakhs at Year 3, the IRR is the rate r that satisfies:
0 = -10,00,000 + 2,00,000/(1+r) + 3,00,000/(1+r)² + 8,00,000/(1+r)³
Solving this equation (typically with a financial calculator or Excel) gives the IRR - the single annualised rate that describes the return of this specific cash flow pattern.
Key assumption: IRR assumes cash flows happen at regular, equal intervals (end of each year in the example above). If your actual cash flows happen on February 13, July 7, and November 22 rather than exactly one year apart, IRR treats them as if they happened at equal intervals - which introduces error.
When IRR is appropriate: Evaluating corporate capital projects, comparing bond investments with regular coupon payments, ranking alternative projects with similar tenures and periodic cash flows.
XIRR: Extended Internal Rate of Return
XIRR is IRR's more accurate sibling. It does the same NPV calculation but uses actual dates for each cash flow rather than assuming regular intervals.
The formula:
0 = Σ [Cash Flow(i) / (1 + XIRR)^((Date(i) - Date(0))/365)]
Where Date(i) - Date(0) is the actual number of days between the transaction and the start date. This means cash flows on February 13, July 7, and November 22 are treated with their actual time gaps - not assumed to be equally spaced.
Why this matters in practice: Consider an SIP investor who missed an instalment in March due to a bank issue, made a double investment in April, and made an early partial withdrawal in August. The actual cash flows are irregular in both timing and amount. XIRR handles this exactly. IRR would have to approximate, introducing meaningful errors in the return calculation.
XIRR is the standard metric for:
Mutual fund SIP/SWP portfolio returns (you will see this on fund statements and platforms like Groww, Zerodha)
Invoice discounting portfolio returns (multiple deals with different start and maturity dates)
Private equity with staged drawdowns and distributions
Any investment portfolio where you have added to or withdrawn from the position over time
CAGR: Compound Annual Growth Rate
CAGR is the simplest of the four metrics and also the most limited. It measures the smoothed annual growth rate between one starting value and one ending value, ignoring everything that happened in between.
Formula:
CAGR = (Ending Value / Starting Value)^(1/Number of Years) - 1
Example: You invest ₹10 lakhs. After 5 years, it is worth ₹16.1 lakhs.
CAGR = (16,10,000 / 10,00,000)^(1/5) - 1 = 10%
CAGR's fundamental limitation: It tells you nothing about what happened in between. An investment that doubled in Year 1 and halved in Year 2, then doubled again in Years 3–5, could show the same CAGR as one that grew steadily at 10% annually. For lump sum investments with no intermediate cash flows, CAGR is perfectly accurate. For anything with interim cash flows (SIPs, dividend payouts, partial withdrawals), CAGR is wrong - use XIRR instead.
Where CAGR is appropriate: Comparing the historical performance of a stock index or mutual fund between two dates; evaluating a single lump-sum investment's total return; benchmarking ("Nifty 50 delivered 14% CAGR over 10 years").
MOIC: Multiple on Invested Capital
MOIC is not an annualised return metric at all - it is an absolute return multiple. It simply measures: how many times did you get back your original investment?
MOIC = Total Cash Received / Total Cash Invested
Example: You invest ₹1 crore in a PE fund. Over 7 years, you receive distributions totalling ₹2.5 crore.
MOIC = 2.5x
MOIC says: you got 2.5 times your money back. It tells you nothing about how long this took - and that is precisely why MOIC and IRR must be used together in private equity analysis, as the next section explains.
XIRR vs IRR: The Core Difference with a Worked Example
| Date | Cash Flow | Days from Start | IRR Assumption (equal intervals) | XIRR (actual dates) |
|---|---|---|---|---|
| 15-Jan-2024 (Investment) | -₹10,00,000 | 0 | Day 0 | Day 0 |
| 15-Apr-2024 (Coupon 1) | +₹25,000 | 90 days | Assumes Day 91.25 (quarter) | Day 90 exactly |
| 22-Jul-2024 (Coupon 2) | +₹25,000 | 188 days | Assumes Day 182.5 | Day 188 exactly |
| 18-Oct-2024 (Coupon 3) | +₹25,000 | 276 days | Assumes Day 273.75 | Day 276 exactly |
| 20-Jan-2025 (Coupon 4) | +₹25,000 | 370 days | Assumes Day 365 | Day 370 exactly |
| 15-Jan-2026 (Final + Principal) | +₹10,25,000 | 730 days | Assumes Day 730 | Day 730 exactly |
Difference Between IRR and XIRR and CAGR
When you calculate IRR using Excel's =IRR() function, it assumes the coupon dates are exactly 90 days apart at equal intervals. The actual dates are slightly different - creating a small but computable difference in the calculated return.
The result: For this bond, the difference between IRR and XIRR is small (a few basis points). But for an invoice discounting portfolio with 20 deals starting on different dates and maturing on different dates, or an SIP with irregular investments, the difference compounds into a material error.
The practical rule: Whenever your cash flows have actual known dates that are not perfectly regular - use XIRR. IRR is a shortcut that introduces error whenever timing is irregular.
XIRR vs CAGR: Why They Give Different Answers for SIPs
This is the most common confusion for retail investors - and it leads to widespread misreporting of mutual fund SIP returns.
The scenario: Priya invests ₹10,000/month in a mutual fund SIP for 3 years (36 instalments = ₹3.6 lakhs total). At the end, the value is ₹4.5 lakhs.
Incorrect CAGR calculation:
CAGR = (4,50,000 / 3,60,000)^(1/3) - 1 = 7.7%
This is wrong because it assumes all ₹3.6 lakhs was invested at the start of 3 years and grew to ₹4.5 lakhs. But only the first ₹10,000 instalment was invested for the full 3 years. The last instalment was invested for only 1 month.
Correct XIRR calculation: Using Excel's =XIRR(cash flows, dates) with each ₹10,000 payment dated on its actual investment date, and ₹4.5 lakhs as the terminal value - XIRR gives approximately 13.1% for this same investment.
Same investment. Same money in. Same money out. CAGR says 7.7%. XIRR says 13.1%. The difference is enormous - and XIRR is correct.
Why such a large difference? CAGR applies the return rate to the total amount across the full period. XIRR correctly recognises that most instalments were invested for much less than 3 years - and therefore need a higher annualised rate to produce the same terminal value. XIRR is the accurate answer.
The implication: Never use CAGR to evaluate SIP returns. Always use XIRR. Any mutual fund return comparison involving multiple investment dates should use XIRR.
The IRR vs MOIC Blind Spot Every Investor Must Know
This is the most dangerous return metric confusion in private equity and AIF investing - and it is widely misunderstood even by sophisticated investors.
The problem: IRR is heavily influenced by the timing of cash flows. A high IRR over a short period does not necessarily mean large absolute returns. Two investments with the same IRR can have very different actual returns if their tenures differ.
Why Is XIRR Higher Than IRR Sometimes?
| Investment | Capital Invested | Capital Returned | MOIC | Tenure | IRR | Which Is Better? |
|---|---|---|---|---|---|---|
| Fund A | ₹1 Crore | ₹1.7 Crore | 1.7x | 2 years | 30% | Higher IRR - but low absolute return |
| Fund B | ₹1 Crore | ₹2.0 Crore | 2.0x | 5 years | 15% | Lower IRR - but more absolute wealth created |
| Fund C | ₹1 Crore | ₹3.0 Crore | 3.0x | 7 years | 17% | Depends on whether you can reinvest Fund A's returns at 30% |
When Should Investors Use IRR?
The core insight: Fund A's 30% IRR is only "better" than Fund B's 15% IRR if you can take Fund A's ₹1.7 crore at Year 2 and immediately reinvest it at 30% for another 3 years. If you cannot find another 30% IRR investment (you almost certainly cannot), Fund B's actual wealth creation of ₹2 crore from ₹1 crore is superior.
This is the reinvestment assumption problem embedded in IRR. IRR implicitly assumes you can reinvest interim cash flows at the same IRR rate. For very high IRRs (25%+), this assumption is almost never realistic.
The practical rule for AIF investors: Always look at both IRR and MOIC when evaluating private equity or Cat II AIF funds. A 25% IRR over 3 years (MOIC ~1.95x) is less wealth creation than 18% IRR over 7 years (MOIC ~3.18x) - even though the IRR headline looks worse.
For context on evaluating AIF fund returns, read: What Are AIFs? A Complete Guide to Alternative Investment Funds in India
Which Metric for Which Investment: The Decision Framework
| Investment Type | Primary Metric | Secondary Metric | Why | Never Use |
|---|---|---|---|---|
| Lump sum equity / index fund | CAGR | Absolute return % | Single investment, single terminal value - CAGR is exactly right | XIRR (no irregular cash flows to account for) |
| Mutual fund SIP | XIRR | Absolute profit (₹) | Multiple investment dates - CAGR systematically understates returns | CAGR (produces meaningfully wrong, lower answer) |
| Invoice discounting portfolio | XIRR | Deal-level annualised yield | Multiple deals with different start and maturity dates - XIRR gives accurate portfolio-level return | Simple average of deal yields (ignores timing and reinvestment gaps) |
| Corporate bond (hold to maturity) | YTM (Yield to Maturity) | XIRR | YTM is the IRR of the bond's cash flows; XIRR is equivalent but more accurate if payment dates are irregular | Coupon rate alone (ignores price paid and time value) |
| Private equity / Category II AIF | IRR (net of fees) | MOIC | IRR is the industry standard; MOIC prevents the reinvestment assumption trap | IRR alone without MOIC |
| Real estate investment | XIRR | CAGR (on capital appreciation) | Rental income + sale proceeds at irregular intervals - XIRR captures the full return picture | CAGR (misses rental income contribution) |
| FD (single deposit, single maturity) | CAGR / effective annual rate | Absolute return ₹ | Simple single cash flow pair - CAGR is accurate and intuitive | XIRR (unnecessary complexity for a simple instrument) |
| Invoice discounting vs FD comparison | XIRR for ID portfolio; CAGR for FD | Post-tax net return for both | Use each instrument's correct metric, then compare on a consistent post-tax annualised basis | Gross yield comparison without tax adjustment |
How to Calculate XIRR in Excel: Step by Step
XIRR is easy to calculate in Excel once you understand the format. Here is the exact process:
Step 1 - Set up your cash flow column
In Column A, enter all your cash flows with a negative sign for money you invested (outflows) and positive sign for money you received (inflows):
A1: -100000 (₹1 lakh invested on Jan 1)
A2: -50000 (₹50,000 invested on Mar 15)
A3: -50000 (₹50,000 invested on Jun 30)
A4: 250000 (₹2.5 lakhs received on Dec 31)
Step 2 - Set up your dates column
In Column B, enter the actual date of each cash flow (Excel date format DD/MM/YYYY):
B1: 01/01/2024
B2: 15/03/2024
B3: 30/06/2024
B4: 31/12/2024
Step 3 - Enter the XIRR formula
In an empty cell, enter:
=XIRR(A1:A4, B1:B4)
Excel returns the XIRR as a decimal - multiply by 100 for percentage. In this example, the answer is approximately 25.3% annualised.
Step 4 - Verify with MOIC Total invested: ₹2 lakhs. Total received: ₹2.5 lakhs. MOIC = 1.25x in approximately 12 months. XIRR of ~25% is consistent with 1.25x in roughly one year - a useful sanity check.
Common XIRR errors:
Forgetting to make the initial investment negative - XIRR will return an error
Using text-formatted dates instead of Excel date values - use Excel's DATE function if needed
Having all cash flows as the same sign - XIRR requires both positive and negative values
XIRR for an invoice discounting portfolio in Excel:
A1: -25000 B1: 01/02/2024 (Deal 1 investment)
A2: -25000 B2: 15/02/2024 (Deal 2 investment)
A3: 26500 B3: 05/04/2024 (Deal 1 return - 63 days, 12% annualised)
A4: 26450 B4: 18/04/2024 (Deal 2 return - 62 days, 11.8% annualised)
A5: -25000 B5: 10/04/2024 (Deal 3 investment from Deal 1 proceeds)
A6: 26600 B6: 10/06/2024 (Deal 3 return - 60 days, 13% annualised)
A7: [current portfolio value] B7: [today]
The XIRR on this portfolio - accounting for reinvestment timing - gives the true annualised return on your deployed capital, including the effect of any gaps between deal maturity and redeployment.
For more on invoice discounting as an investment, read: Invoice Discounting as an Investment
Real Worked Examples: Invoice Discounting, Bonds, SIPs, and AIFs
Example 1 - Invoice Discounting: Annualised Yield vs XIRR Portfolio Return
An investor deploys ₹5 lakhs across 5 invoice discounting deals in February 2024. All deals have a stated yield of 12% annualised on 60-day tenures. When deals mature, there is a 5-day gap before the next deal is deployed. At year end, the XIRR of the full portfolio is approximately 11.2% - slightly below the 12% deal yield - because the 5-day idle periods between deals reduce the effective deployed return.
The lesson: The headline yield on individual deals is not the same as your portfolio XIRR. Minimising idle periods between deals maximises your XIRR and brings it closer to the stated deal yield.
Example 2 - Mutual Fund SIP: CAGR vs XIRR
Investor invests ₹10,000/month for 3 years. Final value: ₹4.5 lakhs. Total invested: ₹3.6 lakhs.
CAGR on total corpus: 7.7%
XIRR (correct metric): 13.1%
The XIRR is correct. The fund performed well - CAGR understates the return by nearly 6 percentage points.
Example 3 - Corporate Bond: YTM vs Coupon Rate
An AA NCD with a 10.5% coupon rate is purchased at ₹1,020 (above face value of ₹1,000). The YTM (which is the XIRR of the bond's cash flows at this purchase price) is approximately 9.7% - lower than the coupon rate because you paid above face value and will receive only ₹1,000 back at maturity. The coupon rate alone overstates your return if you buy at a premium.
Example 4 - Category II AIF: IRR vs MOIC
A private credit AIF reports 16% net IRR over its 4-year fund life on a ₹1 crore commitment.
MOIC = (1 + 0.16)^4 ≈ 1.81x
You received approximately ₹1.81 crore on ₹1 crore invested
Compare to another fund: 20% net IRR over 2.5 years.
MOIC = (1 + 0.20)^2.5 ≈ 1.59x
You received approximately ₹1.59 crore on ₹1 crore invested
The 16% IRR fund created more absolute wealth (₹81 lakh profit vs ₹59 lakh profit) despite the lower IRR - because the tenure was longer. The investor who chose the 20% IRR fund without checking MOIC picked the lower-return outcome.
For guidance on evaluating high-yield investments as an HNI, read: High Yield Investments for HNIs in India Generating 10–18% Annually
Common Mistakes Investors Make with Return Metrics
Mistake 1 - Using CAGR for SIP returns This is the most widespread error in India's retail investing community. CAGR on an SIP portfolio systematically understates returns. Always request or calculate XIRR for any investment with multiple cash flows.
Mistake 2 - Comparing IRR to XIRR directly An 18% IRR on a project with monthly cash flows and an 18% XIRR on an invoice discounting portfolio may sound equivalent - but the underlying cash flow assumptions are different. Always verify what cash flow timing was assumed in the IRR calculation before comparing.
Mistake 3 - Using gross IRR from fund marketing materials Private equity and AIF funds frequently quote gross IRR (before management fees and carried interest). Net IRR is what you actually receive. A fund quoting 25% gross IRR with 2% management fees and 20% carry typically delivers 14–17% net IRR. Always ask for net IRR.
Mistake 4 - Ignoring MOIC when evaluating PE/AIF investments A 30% IRR from a 2-year investment is a 1.69x MOIC - you made 69% on your money in absolute terms. A 20% IRR from a 5-year investment is a 2.49x MOIC - you made 149% on your money. Choosing only on IRR leads you to favour short-duration, low-absolute-return investments over long-duration, high-absolute-return ones.
Mistake 5 - Using deal-level yield as portfolio XIRR Each invoice discounting deal may yield 12% annualised. But if your capital sits idle for 10 days between deals, your portfolio XIRR is approximately 11.2% - not 12%. The gap between reinvestment periods compounds into a meaningful difference across a year.
Mistake 6 - Confusing YTM with coupon rate on bonds The coupon rate is the interest paid on face value. YTM is what you actually earn based on the price you paid. If you buy a bond at a premium (above face value), your YTM is lower than the coupon rate. If you buy at a discount, YTM is higher. Always use YTM (or equivalently, XIRR on the bond's actual cash flows) for honest return comparisons.
For more on bond return calculations and comparisons, read: Best Corporate Bonds in India 2026
FAQs
Q1. What is the difference between XIRR and IRR?
IRR (Internal Rate of Return) assumes cash flows occur at regular, equal intervals. XIRR (Extended Internal Rate of Return) uses actual dates for each cash flow, making it accurate for investments with irregular timing. For most real-world investments - SIPs, invoice discounting portfolios, private equity drawdowns - XIRR is the correct metric. IRR is appropriate when cash flows are genuinely periodic.
Q2. Which is better - XIRR or CAGR for mutual fund SIPs?
XIRR is always more accurate for SIPs. CAGR assumes a single lump-sum investment and systematically understates SIP returns - often by 4–7 percentage points. For the same investment, XIRR might show 13% while CAGR shows 7.7%. XIRR is correct. Use CAGR only for single lump-sum investments.
Q3. How do I calculate XIRR in Excel?
Enter your cash flows in one column (negative for investments, positive for receipts) and the corresponding actual dates in an adjacent column. In an empty cell, enter =XIRR(cash flow range, dates range). The result is the annualised XIRR. Ensure the initial investment is negative and at least one cash flow is positive, otherwise Excel will return an error.
Q4. Why is XIRR different from the stated deal yield in invoice discounting?
Each invoice discounting deal has a stated annualised yield (e.g. 12%). But your portfolio XIRR will be slightly lower than this if there are idle periods between deal maturity and redeployment. A 5-day gap between a 60-day deal's maturity and the next deployment reduces effective portfolio XIRR from 12% to approximately 11.2%. Minimising idle periods maximises your portfolio XIRR.
Q5. When should I use MOIC instead of IRR?
Use MOIC alongside IRR when evaluating private equity, venture capital, or Category II AIF investments. MOIC shows the absolute multiple - how many times you got your money back - without the time-value distortion of IRR. A 30% IRR over 2 years (MOIC 1.69x) creates less absolute wealth than a 15% IRR over 7 years (MOIC 2.66x), even though the IRR headline looks worse. Always check both.
Q6. What is the YTM of a bond and how does it relate to XIRR?
Yield to Maturity (YTM) is the IRR of a bond's cash flows - the single rate that makes the present value of all future coupons and principal repayment equal to the current market price. XIRR calculated on the bond's actual cash flow dates gives an equivalent (and slightly more precise) answer to YTM. Both are more accurate return measures than the stated coupon rate if you buy the bond at any price other than face value.
Q7. Is a higher IRR always better?
Not necessarily - especially when comparing investments of different durations. A higher IRR over a short period may mean lower absolute wealth creation than a lower IRR over a longer period, because of the reinvestment assumption embedded in IRR. A 25% IRR over 2 years (MOIC 1.56x) is less absolute return than an 18% IRR over 5 years (MOIC 2.29x). Always check MOIC alongside IRR for any investment with a defined tenure.
Disclaimer
This article is for informational and educational purposes only and does not constitute investment advice. Return metric calculations involve assumptions that may vary by instrument and context. Please consult a SEBI-registered investment advisor before making investment decisions.